http://www.worldmapper.org/about.html
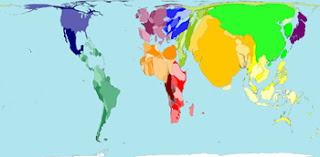
The above map is a cartogram of the entire earth. This specific map represents the earth based on the density of it's people population in each region. The map is colored and labeled using 12 different color shadings. They are each bright and easy to tell apart. Basically a cartogram gives map making the ability to show any variable in/on a region on a map. For instance on this same webpage there is a map same coloring just more realistic of the real world, that is because it's a "land area" cartogram. This one, above, is distorted in order to represent the Population.

No comments:
Post a Comment