http://www.colorado.edu/geography/extra/geogweb/bouldercreek/preview/page2.html
This is a climograph. It represents the monthly temperatures and precipitation averages. This one is for Boudler, Colorado. "Geographers often represent the climate of a place with a climograph" (Colorado.edu).
Saturday, October 22, 2011
Scatter Plot
http://www.stat.yale.edu/Courses/1997-98/101/scatter.htm
A scatterplot is a graph or map of two variables and how they are associated. The above map is a positive association between the years of education and the amount of income one has. It shows that the more years of education the more money one will make. Scatterplots can show negative association or none whatsoever. Positive slopes upward, negative slopes downward and random dots everywhere obviously states that one variable has nothing to do with another.
A scatterplot is a graph or map of two variables and how they are associated. The above map is a positive association between the years of education and the amount of income one has. It shows that the more years of education the more money one will make. Scatterplots can show negative association or none whatsoever. Positive slopes upward, negative slopes downward and random dots everywhere obviously states that one variable has nothing to do with another.
Cartogram
http://www.worldmapper.org/about.html
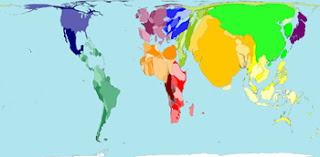
The above map is a cartogram of the entire earth. This specific map represents the earth based on the density of it's people population in each region. The map is colored and labeled using 12 different color shadings. They are each bright and easy to tell apart. Basically a cartogram gives map making the ability to show any variable in/on a region on a map. For instance on this same webpage there is a map same coloring just more realistic of the real world, that is because it's a "land area" cartogram. This one, above, is distorted in order to represent the Population.
The above map is a cartogram of the entire earth. This specific map represents the earth based on the density of it's people population in each region. The map is colored and labeled using 12 different color shadings. They are each bright and easy to tell apart. Basically a cartogram gives map making the ability to show any variable in/on a region on a map. For instance on this same webpage there is a map same coloring just more realistic of the real world, that is because it's a "land area" cartogram. This one, above, is distorted in order to represent the Population.
Friday, October 21, 2011
Mental Map
http://www.fedstats.gov/kids/mapstats/concepts_mentalmaps.html
The above map is called a Mental Map. It is a map that evolves from the mind of a human. Each person has their own ways to mental map. "A mental map can best be explained as a visual display, inside a person's head, showing where a person has traveled" (fedstats). Mental maps consist of the knowledge one has personally gained. The maps might include things that are of interest to that person. For instance, a boy who loves fishing might draw a lake he walks by on the way to school, while a girl who loves flowers draws the garden on the way to school. The above map is a mental map or drawing of a person's vision of a neighborhood they have been to. It qualifies as a mental map because it is drawn from that of the mind of a person and it includes symbols, names and buildings that the person can remember and/or thinks is important.
The above map is called a Mental Map. It is a map that evolves from the mind of a human. Each person has their own ways to mental map. "A mental map can best be explained as a visual display, inside a person's head, showing where a person has traveled" (fedstats). Mental maps consist of the knowledge one has personally gained. The maps might include things that are of interest to that person. For instance, a boy who loves fishing might draw a lake he walks by on the way to school, while a girl who loves flowers draws the garden on the way to school. The above map is a mental map or drawing of a person's vision of a neighborhood they have been to. It qualifies as a mental map because it is drawn from that of the mind of a person and it includes symbols, names and buildings that the person can remember and/or thinks is important.
Subscribe to:
Comments (Atom)


